Multinomial random effects models in R
This post is partly a response to this message. The author of that question is working on ordered categorical data. For that specific case, there are several packages in R that might work, none of which I’ve tried. The most promising is the function DPolmm() from DPpackage. It’s worth noting, though, that in that package you are committed to a Dirichlet Process prior for the random effects (instead of the more standard Gaussian). A different package, mprobit allows one clustering factor. This could be suitable, depending on the data set. MNP, mlogit, multinomRob, vbmp, nnet, and msm all offer some capability of modeling ordered categorical data, and it’s possible that one of them allows for random effects (though I haven’t discovered any yet). MCMCpack may also be useful, as it provides MCMC implementations for a large class of regression models. lrm() from the Design package handles ordered categorical data, and clustered bootstrap sampling can be used for a single cluster effect.
I’ve recently had some success using MCMCglmm for the analysis of unordered multinomial data, and want to post a quick annotated example here. It should be noted that the tutorial on the CRAN page is extremely useful, and I encourage anyone using the package to work through it.
I’m going to cheat a bit in my choice of data sets, in that I won’t be using data from a real experiment with a multinomial (or polychotomous) outcome. Instead, I want to use a publicly available data set with some relevance to language research. I also need a categorical dependent variable with more than two levels for this demo to be interesting. Looking through the data sets provided in the languageR package, I noticed that the dative data set has a column SemanticClass which has five levels. We’ll use this as our dependent variable for this example. We’ll investigate whether the semantic class of a ditransitive event is influenced by the modality in which it is produced (spoken or written).
library(MCMCglmm)
data("dative", package = "languageR")

k <- length(levels(dative$SemanticClass))
I <- diag(k-1)
J <- matrix(rep(1, (k-1)^2), c(k-1, k-1))

m <- MCMCglmm(SemanticClass ~ -1 + trait + Modality,
              random = ~ us(trait):Verb + us(Modality):Verb,
              rcov = ~ us(trait):units,
              prior = list(
                R = list(fix=1, V=0.5 * (I + J), n = 4),
                G = list(
                  G1 = list(V = diag(4), n = 4),
                  G2 = list(V = diag(2), n = 2))),
              burnin = 15000,
              nitt = 40000,
              family = "categorical",
              data = dative)
Read on for an explanation of this model specification, along with some functions for evaluating the model fit.
The first two lines load the MCMCglmm package and give us access to the dative data set without loading all of the languageR package.
The next three lines set up some useful constants for us. k is the number of categories in our outcome variable. I and J are matrices that we’ll use to set up constraints on the covariance structure of the residuals.
The remainder of the code specifies the multinomial model, and we’ll break it down into smaller chunks.
SemanticClass ~ -1 + trait + Modality,
This first line specifies the dependent variable, SemanticClass, and the fixed effects, -1 + trait + Modality. The term trait is not part of the original data set– rather, it’s a reserved term in the MCMCglmm package. trait comes from phylogenetics, where the dependent variable is some observed trait in an organism. For our purposes, including the trait term tells the model to estimate an intercept for each of the observed outcomes. We follow the advice from the tutorial and enter this as -1 + trait. This guarantees an intercept for each non-baseline level of the outcome, rather than an overall intercept term with an offset for k-2 levels.
random = ~ us(trait):Verb + us(Modality):Verb,
The next line specifies our random effects. To the right of the colon is the variable in our data that will be used as a grouping variable, in this case Verb. The content on the left side of the colon specifies which fixed effects will also have random offsets. These fixed effects are wrapped in a function call which defines the structure of the variance-covariance matrix for that random effect. In this case, we’re allowing an unstructured variance-covariance matrix for the levels of the outcome and the Modality of the observation. The other relevant possibility would be to use idh(trait):Verb, which constrains the random effects to be uncorrelated. For more information on these specifications, see page 12 of the tutorial.
rcov = ~ us(trait):units,
This line specifies the structure of the residuals. units is another reserved word in MCMCglmm, in this case referring to each individual observation. This specification of the variance-covariance matrix of the residuals allows arbitrary correlations in the errors. Again, see page 12 of the tutorial for the precise terms being fit.
prior = list(

R = list(fix=1, V=0.5 * (I + J), n = 4),
Now we define the priors for the model. This is done using some structures defined by MCMCglmm. The R-structure is the variance-covariance matrix for the residuals. The G-structure is the variance-covariance matrix for the random effects (which is itself a list of sub-specifications, one per random effect). These structures are defined on pages 16-19 of the tutorial.
The R-structure in this case is set to have a fixed form (fix = 1). The reasoning behind this decision is given on page 9 of the tutorial. Basically, for data such as we have here where each observation is a single sample from a distribution over k categorical outcomes, we can’t actually estimate the residual variance because it depends entirely on the mean (think of the binomial distribution in the simplest case). We follow the prescriptions from the package authors for working with data from this type of distribution, fixing the variance to be 1 for all of the diagonal terms (variances) and .5 for all of the off-diagonal terms (covariances). This advice can be found in the table on page 23 of the tutorial, with further information on page 21.
G = list(

G1 = list(V = diag(4), n = 4),

G2 = list(V = diag(2), n = 2))),
Here are the priors on the random effects. When priors are not fixed, they are inverse-Wishart distributed. V is a hyperprior on the variance-covariance matrix (the inverse scale matrix), and n can be thought of as a degree-of-belief parameter. The tutorial suggests that n >= k to aid in convergence. Here we choose the lowest n that results in a proper prior, or the least-informative proper prior (but not an uninformative prior).
burnin = 15000,

nitt = 40000,
Here we specify how many samples to generate. The burnin argument sets the number of samples generated in the burn in period. The goal is to converge on a set of stable estimates for the model parameters. We know that this won’t happen instantaneously, and so we allow the model some time to try to settle on a good set of parameters before we start collecting samples. These initial throwaway samples comprise the burn in period, and the number of such samples to be generated is set by the burnin argument. After the burn in period, we sample each parameter from the model a certain number of times, controlled by the nitt argument. There’s no guarantee that the model will have settled on stable estimates by the end of burn in, though, so it will be important to test whether the model has converged in the samples we end up using. It should also be noted that it is possible to discard samples as they’re collected using the thin parameter. This is usually done to try to minimize dependence between samples.
family = "categorical",

data = dative)
We use the "categorical" family, appropriate for data that consists of one line per observation. If we had multinomial count data, we would use the "multinomialK" family, where K is the number of levels in the dependent variable. In this case, if the data were restructured as multinomial count data, we would use family = "multinomial5". To restructure the data, we could use something like
library(reshape)

dative.melt <- melt(dative,

id.vars = c("Modality", "Verb"),

measure.vars = c("SemanticClass"))

dative.wide <- cast(dative.melt, Verb ~ value)
But in this case, it works just as well to use the original data and the family = "categorical" argument to MCMCglmm.
When we run the model, we’ll get output like
MCMC iteration = 0

E[MH acceptance ratio] = 0.000168

MCMC iteration = 1000

E[MH acceptance ratio] = 0.263537

MCMC iteration = 2000

E[MH acceptance ratio] = 0.261401
This tells us that the model is being fit using the Metropolis-Hastings algorithm (MH), not Gibbs sampling. It also tells us the proportion of samples in each set of one thousand that is accepted. An acceptance rate that’s too high means that the space will explored very slowly. Anecdotally, an acceptance rate between .25 and .5 seems to indicate good performance.
After fitting the model, we can start by examining the result object, m.
> str(m)
List of 8
 $ Sol     : mcmc [1:2500, 1:5] -0.833 -2.191 -1.027 -0.978 -2.456 ...
  ..- attr(*, "dimnames")=List of 2
  .. ..$ : NULL
  .. ..$ : chr [1:5] "traitSemanticClass.c" "traitSemanticClass.f" "traitSemanticClass.p" "traitSemanticClass.t" ...
  ..- attr(*, "mcpar")= num [1:3] 1 2500 1
 $ VCV     : mcmc [1:2500, 1:36] 9.45 11.18 7.02 7.78 7.33 ...
  ..- attr(*, "dimnames")=List of 2
  .. ..$ : NULL
  .. ..$ : chr [1:36] "Verb.trait.SemanticClass.c.SemanticClass.c" "Verb.trait.SemanticClass.f.SemanticClass.c" "Verb.trait.SemanticClass.p.SemanticClass.c" "Verb.trait.SemanticClass.t.SemanticClass.c" ...
  ..- attr(*, "mcpar")= num [1:3] 1 2500 1
 $ Liab    : NULL
 $ Fixed   :Class 'formula' length 3 SemanticClass ~ -1 + trait + Modality
  .. ..- attr(*, ".Environment")=
 $ Random  :Class 'formula' length 2 ~us(trait):Verb + us(Modality):Verb
  .. ..- attr(*, ".Environment")=
 $ Residual:Class 'formula' length 2 ~us(trait):units
  .. ..- attr(*, ".Environment")=
 $ Deviance:Class 'mcmc'  atomic [1:2500] 3079 3063 3101 3062 3127 ...
  .. ..- attr(*, "mcpar")= num [1:3] 1 2500 1
 $ DIC     : num 3572
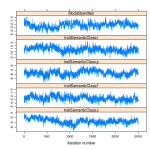
Of immediate interest are the m$Sol and m$VCV members of the list. The former are for the fixed effects parameters, and the latter are the variance-covariance matrices associated with the residuals and the random effects. These each have the class mcmc, meaning they represent samples from an MCMC fit. In this case, we have all of the samples generated by the model after the burn-in period. We can start our examination of the fixed effects (stored in m$Sol) using some visualizations provided by the coda and lattice packages.


Next we can look at the numeric estimates of the fixed effects.
> summary(m$Sol)

Iterations = 1:2500
Thinning interval = 1
Number of chains = 1
Sample size per chain = 2500

1. Empirical mean and standard deviation for each variable,
   plus standard error of the mean:

                        Mean     SD Naive SE Time-series SE
traitSemanticClass.c -3.4160 1.0983  0.02197        0.11372
traitSemanticClass.f -2.5098 0.7304  0.01461        0.06545
traitSemanticClass.p -5.3633 1.2252  0.02450        0.12210
traitSemanticClass.t  0.7708 0.8786  0.01757        0.07661
Modalitywritten      -2.2994 0.7708  0.01542        0.07250

2. Quantiles for each variable:

                        2.5%     25%     50%    75%   97.5%
traitSemanticClass.c -5.6219 -4.1561 -3.4069 -2.694 -1.2674
traitSemanticClass.f -3.8757 -3.0037 -2.5280 -2.033 -1.0036
traitSemanticClass.p -7.7261 -6.2194 -5.2755 -4.504 -3.1063
traitSemanticClass.t -0.9578  0.1640  0.7919  1.363  2.4537
Modalitywritten      -3.8277 -2.7963 -2.2668 -1.778 -0.8377
Finally, we can check out the Highest Posterior Density intervals for the fixed effects.
> HPDinterval(m$Sol)
                          lower      upper
traitSemanticClass.c -5.4157540 -1.1619380
traitSemanticClass.f -3.9443586 -1.0921360
traitSemanticClass.p -7.7055507 -3.0929750
traitSemanticClass.t -0.9460623  2.4557778
Modalitywritten      -3.7766821 -0.7944914
attr(,"Probability")
[1] 0.95
If I were dealing with a real data set, I would also run the exact same model a few more times, saving each set of results separately. This allows us to test for model convergence by comparing results across runs of the model (see gelman.diag). Other convergence metrics that would be important to check for any real data would be heidel.diag, geweke.diag, and raftery.diag. I find the Raftery test to be relatively intuitive to interpret, but it can require generating a large number of samples.
Questions can be left here in the comments, or can be sent to the R-lang list.

May 14, 2009 at 2:58 pm
Cool, very nice introduction. One question I have, though, is how to incorporate alternative-specific variables in this framework. The example you have here has just one item-specific variable, Modality, but some of the data I’m working with seems like it would best be modeled by a combination of item-specific and alternative-specific predictors. I’ve been playing around recently with the mlogit package, which allows you to specify such models very nicely (“dependent ~ altSpec1 + … + altSpecN | itemSpec1 + … + itemSpecM”), but it doesn’t support random effects.
LikeLike
November 22, 2009 at 11:38 am
An interesting introduction. Has this advanced any further to hierarchical random effect models for multinomial responses?
LikeLike
January 30, 2010 at 4:25 pm
Cool introduction, thanks.
LikeLike
January 3, 2011 at 9:48 am
[…] Multinomial random effects models in R May 2009 3 comments 4 […]
LikeLike
September 21, 2011 at 1:15 am
hi
in first place, thank very much for you contribution.
i write you for make you a little question. I have how response variable a discrete variable with 4 states, (my independent variable is continuous) , so I use the variance structure of the fixed effects and random-as you propose in your mini-tutorial. the problems to be admitted to the program gives me an error: object ‘J’ not found. any idea why this happens?
I hope your answer please.
regards
LikeLike
September 21, 2011 at 2:13 am
Dear Oscar,
J is part of the specification of the prior. It’s best you read the course notes and the vignette for the MCMCglmm package by Hadfield. They contain a lot of useful information (I started working with this package myself recently)
LikeLike
June 7, 2012 at 10:57 am
I’ve started learning how to use MCMCglmm to fit linear mixed-effects models recently. I wonder how one can conduct multiple comparisons after one obtains a significant interaction. With lmer(), we can use glht() in the multcomp package, but I haven’t been able to find a comparable method for MCMCglmm. Any suggestion would be much appreciated!
Best,
Xiao
LikeLike
June 7, 2012 at 11:09 am
Dear Xiao,
I almost always code interactions a priori based on theoretical considerations, so I haven’t been using glht() and, unfortunately, know of no equivalent for MCMCglmm, but perhaps someone else reading this has an answer?
Florian
LikeLike
June 7, 2012 at 11:18 am
Thanks for the reply! I wonder if you can suggest a couple of articles/textbooks/tutorials on coding interactions a priori. I would be very interested in learning it. Thank you again
LikeLike
June 7, 2012 at 11:55 am
Hi Xiao,
Maureen Gillespie (Illinois) put together a coding tutorial, which is available here: https://hlplab.wordpress.com/2010/05/10/mini-womm/. It also contains references.
HTH,
Florian
LikeLike
May 17, 2013 at 8:17 am
Thank you so much for this summary! I spent the whole day trying to get the hang of the MCMCglmms, as I am totally new to it, but this summary finally helped me to get a model. However, now I am not entirely sure whether I used the right prior settings (despite reading through the descriptions over and over again the mathematics behind it seem to be beyond me).
k <- length(levels(part$Level))
I <- diag(k-1)
J <- matrix(rep(1, (k-1)^2), c(k-1, k-1))
m <- MCMCglmm(Level ~ -1+trait +Fixed1 +Fixed2+Fixed3 + Fixed4 + Fixed5 +
Fixed6 +Fixed7 +Fixed8,
random = ~ us(trait):IndividualID +us(trait):GroupDyad,
rcov = ~ us(trait):units,
prior = list(
R = list(fix=1, V=0.5 * (I + J), n = 5),
G = list(
G1 = list(V = diag(4), n = 5),
G2 = list(V = diag(4), n = 5))),
burnin = 15000,
nitt = 40000,
family = "categorical",
data = part)
So this is basically what I did, I have my levels in one collumn, which I hope works out? And the Level is a categorical variable with the classes (0,1,2,3,4), from what I got so far with the model I have it compares it all to 0, is that right? the prior settings for R I basically just took from what you wrote, and the model seems to run, but I am not sure whether its right, cause my fixed variables have different distributions (some are poisson, some categorical and one even binomial). Do you need to take that into account when formulating the R?
Thanks a lot for your help!!
Anna
LikeLike
June 26, 2013 at 12:18 am
It is a very nice tutorial. However I have a question about how to explain the result?
In multinomial logistic regression model, there should be 4 coefficients for Modalitywritten:
Modalitywritten class c (compare to the baseline)
Modalitywritten class f
Modalitywritten class p
Modalitywritten class t
but here in this example, we only got one. How should we explain the influence of modality (written) to each class?
Thanks very much!
Renee
LikeLike
June 26, 2013 at 6:29 pm
Dear Renee,
The coefficient for modality here describes the effect of modality on all levels of SemanticClass (c,f,p,t). That is, the model described here assumes that the effect of modality is identical at all levels of SemanticClass (i.e., additive to the class intercepts).
I haven’t used MCMCglmm much, but I assume to relax that assumption, you would add the interaction of modality and trait to the fixed effect structure of the model, changing
SemanticClass ~ -1 + trait + Modalityto
SemanticClass ~ -1 + trait * ModalityI tried that and it seems to yield the desired result. I used a much shorter burnin and collected fewer samples, so the estimates given below are not to be trusted, but they illustrate my point:
Iterations = 1001:3991

Thinning interval = 10

Number of chains = 1

Sample size per chain = 300
1. Empirical mean and standard deviation for each variable,
plus standard error of the mean:
Mean SD Naive SE Time-series SE
traitSemanticClass.c -2.12514 0.7814 0.04511 0.12300
traitSemanticClass.f -1.39007 0.6487 0.03745 0.08351
traitSemanticClass.p -2.66922 0.8521 0.04919 0.13989
traitSemanticClass.t 0.49969 0.7906 0.04564 0.10948
Modalitywritten -1.68676 0.7375 0.04258 0.12506
traitSemanticClass.f:Modalitywritten -0.73914 0.2808 0.01621 0.12319
traitSemanticClass.p:Modalitywritten -0.02762 0.2256 0.01303 0.10308
traitSemanticClass.t:Modalitywritten -0.75859 0.2458 0.01419 0.08884
2. Quantiles for each variable:
2.5% 25% 50% 75% 97.5%
traitSemanticClass.c -3.7766 -2.6081 -2.08930 -1.5495 -0.7722
traitSemanticClass.f -2.7074 -1.8566 -1.39134 -0.9053 -0.2231
traitSemanticClass.p -4.3854 -3.2386 -2.70065 -2.1575 -0.9850
traitSemanticClass.t -0.9317 -0.1557 0.52490 1.0610 2.0400
Modalitywritten -2.9807 -2.2319 -1.72275 -1.2190 -0.1443
traitSemanticClass.f:Modalitywritten -1.1657 -0.9783 -0.77251 -0.5448 -0.1313
traitSemanticClass.p:Modalitywritten -0.4315 -0.2071 -0.02458 0.1360 0.3805
traitSemanticClass.t:Modalitywritten -1.2067 -0.9253 -0.74746 -0.6360 -0.1994
HTH,
Florian
LikeLiked by 1 person
August 27, 2013 at 7:09 pm
Thanks so much for this. Seems to be working, I got a running model but I have no idea how to interpret the output. The tutorial you reference is somewhat helpful, but the questions are so different than mine.
I am attempting an analyses as follows:
Background: We are attempting to describe the potential bias that arises from the use of different resolutions of imagery when trying to determine ‘on-the-ground’ vegetation at a given point
Question: does spatial resolution influence the probability that a technician will describe the vegetation at a point as a tree, shrub, or herbaceous vegetation, etc…
Objective: model the effect of imagery resolution (i.e. pixel size) in determining the ‘call’ made by a technician
Data: We have selected 109 points clustered within 33 ‘plots’, at each point there is a ‘call’ of tree, shrub, herb, bare, or other. This was done 4 times for each point, at image resolutions of 1m, 50cm, 10cm, and using aerial imagery from the National Agricultural Inventory Program (NAIP). Plots are spaced at least 6km apart along a grid
So the data looks like this:
Plot               Point          Call                       Resolution

41-69-6644         1              Tree                       1m

41-69-6644         1              Tree                       10cm

41-69-6644         1              Tree                       50cm

41-69-6644         1              Tree                       naip

41-69-6644         2              Herbaceous                 1m

41-69-6644         2              Shrub                      10cm

41-69-6644         2              Shrub                      50cm

41-69-6644         2              Tree                       naip
and my code looked like this:
model = MCMCglmm(Call~ -1 + trait + Res,

                       random = ~us(trait):Plot,

                       rcov = ~ us(trait):units,

                       prior = list(

                                     R = list(fix=1, V=0.5 * (I + J), n = 4),

                                     G = list(

                                              G1 = list(V = diag(4), n = 4))),

                                     burnin = 1000,

                                     nitt = 6000,

                       family = "categorical",

                       data = res.data)
I only did a few iterations just for exploratory purposes.
Here is some output:
Location effects: Call ~ -1 + trait + Res
                     post.mean l-95% CI u-95% CI eff.samp  pMCMC

traitCall.Herbaceous   3.8063   3.0089   4.5007    6.954 <0.002 **

traitCall.Other            -0.7597  -1.2783  -0.2033    3.520 <0.002 **

traitCall.Shrub             3.8189   3.0808   4.5369    5.561 <0.002 **

traitCall.Tree               2.1910   1.2333   3.2048   24.191 <0.002 **

Res1m                        1.0131   0.3714   1.3977    2.434 <0.002 **

Res50cm                    0.0239  -0.1985   0.2294    6.899  0.752

Resnaip                     0.7726   0.2696   1.0761    3.292 <0.002 **

---
Am I right in thinking that the last three lines are what I am interested in? Are these saying that relative to the 10cm resolution, the calls made at 50cm were not significantly different, but the other two were different? Further, is it possible to further examine what might be causing the differences of the 1m and NAIP scale (i.e. when the call at 10cm was 'shrub' more misclassification occurred).
Cheers my friend, you were of great help.
Jesse Poulos
LikeLike
August 29, 2013 at 4:43 am
Dear Jesse,
let me see whether I can help. (btw, I took the liberty to remove what I took to be a typo from your comment — I think you meant 1m, 50cm, amd 10cm rather than 10cm, 50cm, and 10cm resolution?)
In the output you present, the interpretation of the coefficients would depend on the factor coding you employed. I will assume that you didn’t specify any coding explicitly, in which case R will employ treatment coding. Since treatment coding can lead to collinearity between factor levels (especially, if you don’t have data that is balanced with respect to the factor levels), you might want to consider sum coding (aka ANOVA coding). I recommend Maureen Gillespie’s tutorial on factor coding in R, linked to this blog. E.g., you could do:
res.data$Res = factor(res.data$Res, levels = c("10cm", "50cm", "1m", "naip"))

contrasts(res.data$Res) = contr.sum(4)

contrasts(res.data$Res)
The first four lines describe the predicted mean log-odds of the four responses when the resolution is “10cm”. “10cm” was chosen as base line by default as its alphanumerically the first of the four levels of Res, but it also make sense (since it’s presumably the highest resolution?).
The next three lines describe the treatment effects of Resolution. Minus any problems with collinearity (which, for example, could cause insignificance), your interpretation of these effects is correct.
In order to investigate whether classification of different categories (shrub, tree, etc.) was affected differently by the resolution, you would need to add the interaction of trait and resolution to your model (i.e.,
trait * Res, rather thantrait + Res).Note also that your model currently only contains random intercepts. You did not specify random slopes for the resolution effect (or the interaction of trait and the resolution). The absence of random slopes of an effect (e.g., the absence of random slopes for the resolution effect) makes the evaluation of that effect anti-conservative. Perhaps it’s the best you can do with the data you have, but I wanted to mention it.
Florian
LikeLike
August 29, 2013 at 11:56 am
Tiflo,
Thanks for the hasty response, and I hope I can tug your eyes and brain a little longer.
Ahh, yes, you are right in your correction. it should for 10cm, 50cm, and 1m (and NAIP).
Also, last night I did include the treat*Res term for interactions since this is precisely the information we are seeking. This morning when I checked, I found that it only performed a test for 3/5 of my response classes (Tree, shrub and other), leaving out bare ground, and herbaceous. Do you know if there are any good reasons this might be happening? I assume that it has to do with having a baseline reference class, but I would expect to see at least 4/5 comparisons if that were the case… That said, when I restructure my data as a column for each class and use class multinomialk, the issue disappears, but the results differ; might this multinomialk approach still be valid or perhaps better?
I did suspect that I would need to do some factor recoding. It changed the output dramatically when I did so. I wonder though, when running contrasts(res.data$Res) why is the last row -1, -1, -1, -1, instead of 0, 0, 0, 0. Is this more or less arbitrary dummy coding?
How exactly do I specify the random slopes anyway? Instead of random = ~us(trait):Plot, use random = ~us(1+trait):Plot?
Lastly, what exactly are the estimates in the summary telling me. Say the estimate was 3 for the when comparing tree calls at the 10cm scale vs the 1m scale. Does this mean the at the 1m scale I am 3 times more likely to pick trees?
Thanks again, you are making me look like a pro at work. I’m surprised they are consulting an ecologist as a statistician; I have no one to consult besides the interwebs, so much thanks.
JP
LikeLike
August 29, 2013 at 3:29 pm
Hi JP,
since I had a couple of classes of wine and beer, let me focus on the basics. (otherwise, we have drunk linguist advising an economist advising ….).
As for only getting only three coefficients, that makes sense. First, consider the case without an interaction. You specified
-1 + trait, which should give you four parameters for the five outcomes. The probability of the fifth outcome is 1 – the sum of the probabilities of all four other outcomes. Hence, no fifth parameter is required. That’s what you saw in the output.Now consider the case with an interaction. For simplicity’s sake, let’s assume that
resis still treatment coded. The effect ofreshas three parameters and so does its interaction withtrait. In this model, the ‘main’ effect ofrespredict the treatment effect ofresfor whatever level oftraitis not given an interaction (i.e., herbaceous). The treatment effects ofresfor tree, shrub, and other given by the interaction terms. Finally, the predictions for the fifth level of the outcome (i.e., bare ground) are derived just the same way as in the first model: the predicted probability of the fifth outcome is 1 – the sum of the probabilities of all four other outcomes.Essentially, the ‘main’ effects of
traitare all intercepts. The effect ofresand its interaction withtraittogether describe the effect of resolution at the different levels oftrait.As for the coding advice I gave, I recommended sum-coding, not dummy/treatment-coding. The code I provided did that. The contrasts are the columns and by default the last column will be the one that everything is compared against (hence the -1). But for more detail I recommend Maureen’s tutorial. It has exercises that are good to work through to get a more solid understanding of the different coding options.
Finally, you asked how to read the estimates. The estimates are the coefficients in log-odds. Let’s go through an example once we have ascertained that the above code works? (let me know).
Florian
LikeLiked by 1 person
August 29, 2013 at 4:31 pm
Flo,
For some reason I can’t place my reply below your latest post, so I appologize if this post is out of place.
Just to be clear, my dependent response (Call) has 5 classes (Tree, shrub, herb, bare, other) while my resolution predictor (Res) has 4 classes (10cm, 50cm, 100cm, and NAIP).
I am somewhat confused now, as I thought your examples response also had 5 levels, yet it appears as if you used k=4 in your prior…
Here is what my newest code-block is looking like, note, I’ve reorganized your recommended sum coding so 10cm is the reference level:
#convert treatment coding to sum coding
res.data.s = res.data
res.data.s$Res = factor(res.data.s$Res, levels = c(“50cm”, “1m”, “naip”, “10cm”))
contrasts(res.data.s$Res) = contr.sum(4)
contrasts(res.data.s$Res)
k <- length(levels(res.data.s$Call)) #to double check this ended up being 5 as it should
I <- diag(k-1)
J <- matrix(rep(1, (k-1)^2), c(k-1, k-1))
model = MCMCglmm(Call~ -1 + trait * Res,
random = ~us(trait):Plot,
rcov = ~ us(trait):units,
prior = list(
R = list(fix=1, V=0.5 * (I + J), n = 5),
G = list(
G1 = list(V = diag(5), n = 5))),
burnin = 100,
nitt = 500,
family = "categorical",
data = res.data.s)
This produces the following error:
Error in priorformat(if (NOpriorG) { :
V is the wrong dimension for some prior$G/prior$R elements
Perhaps this is arising from some confusion about my response having 5 levels and my predictor having 4 levels? Am I missing something here? It only works if my prior is:
R = list(fix=1, V=0.5 * (I + J), n = 4), #this can also run if it is set as 5, but only if G1 has 5's as 4's
G = list(
G1 = list(V = diag(4), n = 4))),
Thanks again, and I do hope you are enjoying your beer and wine
JP
LikeLike
August 29, 2013 at 6:06 pm
Oh, I really shouldn’t drink and write. You’re absolutely right. The example was for a 5-level response variable and you had done everything alright. In order not to confuse others, I revised my original answer to your question above. I hope it helps. Can you post the output of the interaction model as you originally ran it?
LikeLiked by 1 person
August 29, 2013 at 7:15 pm
Flo,
Absolutely. This model is obviously not accurate due to the short burn in etc… but I just wanted to get a quick example output.
model5frs = MCMCglmm(Call~ -1 + trait * Res,
random = ~us(trait):Plot,
rcov = ~ us(trait):units,
prior = list(
R = list(fix=1, V=0.5 * (I + J), n = 4),
G = list(
G1 = list(V = diag(4), n = 4))),
burnin = 100,
nitt = 500,
#thin = 100,
family = “categorical”,
data = res.data.s)
OUTPUT BELOW:
Iterations = 101:491
Thinning interval = 10
Sample size = 40
DIC: 26325.25
G-structure: ~us(trait):Plot
post.mean l-95% CI u-95% CI eff.samp
Call.Herbaceous:Call.Herbaceous.Plot 1.3104 0.77742 1.95209 40.00
Call.Other:Call.Herbaceous.Plot 0.1647 -0.10811 0.36195 80.87
Call.Shrub:Call.Herbaceous.Plot 0.2836 -0.15647 0.69475 36.40
Call.Tree:Call.Herbaceous.Plot -1.2054 -2.61764 -0.47034 40.00
Call.Herbaceous:Call.Other.Plot 0.1647 -0.10811 0.36195 80.87
Call.Other:Call.Other.Plot 0.2514 0.14707 0.41632 40.00
Call.Shrub:Call.Other.Plot 0.1941 -0.02443 0.47858 40.00
Call.Tree:Call.Other.Plot -0.1844 -0.65000 0.06387 40.00
Call.Herbaceous:Call.Shrub.Plot 0.2836 -0.15647 0.69475 36.40
Call.Other:Call.Shrub.Plot 0.1941 -0.02443 0.47858 40.00
Call.Shrub:Call.Shrub.Plot 1.0291 0.55959 1.61985 59.94
Call.Tree:Call.Shrub.Plot -0.8194 -1.60903 -0.28891 29.60
Call.Herbaceous:Call.Tree.Plot -1.2054 -2.61764 -0.47034 40.00
Call.Other:Call.Tree.Plot -0.1844 -0.65000 0.06387 40.00
Call.Shrub:Call.Tree.Plot -0.8194 -1.60903 -0.28891 29.60
Call.Tree:Call.Tree.Plot 2.2644 1.09706 4.38641 22.29
R-structure: ~us(trait):units
post.mean l-95% CI u-95% CI eff.samp
Call.Herbaceous:Call.Herbaceous.units 1.0 1.0 1.0 0
Call.Other:Call.Herbaceous.units 0.5 0.5 0.5 0
Call.Shrub:Call.Herbaceous.units 0.5 0.5 0.5 0
Call.Tree:Call.Herbaceous.units 0.5 0.5 0.5 0
Call.Herbaceous:Call.Other.units 0.5 0.5 0.5 0
Call.Other:Call.Other.units 1.0 1.0 1.0 0
Call.Shrub:Call.Other.units 0.5 0.5 0.5 0
Call.Tree:Call.Other.units 0.5 0.5 0.5 0
Call.Herbaceous:Call.Shrub.units 0.5 0.5 0.5 0
Call.Other:Call.Shrub.units 0.5 0.5 0.5 0
Call.Shrub:Call.Shrub.units 1.0 1.0 1.0 0
Call.Tree:Call.Shrub.units 0.5 0.5 0.5 0
Call.Herbaceous:Call.Tree.units 0.5 0.5 0.5 0
Call.Other:Call.Tree.units 0.5 0.5 0.5 0
Call.Shrub:Call.Tree.units 0.5 0.5 0.5 0
Call.Tree:Call.Tree.units 1.0 1.0 1.0 0
Location effects: Call ~ -1 + trait * Res
post.mean l-95% CI u-95% CI eff.samp pMCMC
traitCall.Herbaceous 2.017779 1.319766 2.631103 3.728 <0.03 *

traitCall.Other -0.059957 -0.277582 0.167994 40.000 0.55

traitCall.Shrub 1.985699 1.219209 2.716203 2.025 <0.03 *

traitCall.Tree 0.863295 0.381788 1.431208 4.532 <0.03 *
Res1m 0.251940 0.141353 0.350335 5.852 <0.03 *
Resnaip -0.124915 -0.286551 0.043194 5.987 0.10 .
Res10cm 0.007258 -0.138939 0.135456 3.257 1.00
traitCall.Other:Res1m -0.160500 -0.257337 -0.062635 4.673 <0.03 *
traitCall.Shrub:Res1m -0.382345 -0.469192 -0.284058 11.096 <0.03 *
traitCall.Tree:Res1m -0.048957 -0.165548 0.064457 10.073 0.35
traitCall.Other:Resnaip 0.068419 -0.112842 0.193998 5.869 0.40
traitCall.Shrub:Resnaip 0.290083 0.213862 0.402369 11.026 <0.03 *
traitCall.Tree:Resnaip 0.492460 0.355131 0.631961 7.151 <0.03 *
traitCall.Other:Res10cm -0.066982 -0.166105 -0.001008 12.644 0.05 *
traitCall.Shrub:Res10cm 0.209294 0.114260 0.332900 9.099 <0.03 *
traitCall.Tree:Res10cm -0.018507 -0.134081 0.101332 5.141 0.75
Note that right now 50cm is the reference resolution. I will have to fix that later. But anyway, to remind you of my questions. I don't quite see why there are only three within Call (ie. tree) across resolution comparisons for the interaction and I also don't know quite how these would be interpreted in a useful context (ie, we know they are significant, but how do I translate the magnitude to something the lay-person can understand).
Also,
How exactly do I specify the random slopes anyway? Instead of random = ~us(trait):Plot, use random = ~us(1+trait):Plot?
Cheer mate!
JP
LikeLike
August 30, 2013 at 2:59 am
Hey JP,
thanks for posting the model. I tried to explain why you only get three `interaction’ terms in the earlier post that I revised based on your comments. Part of the trick in understanding this is to see that this isn’t really an ordinary interaction (since
traitis not like an ordinary factor). First consider the following model with only an ordinary intercept:Model 1: Call~ +1It’s hard to see what Model 1 would mean ( the intercept would describe the log-odds of any of the four non-baseline outcomes over the baseline). Since we’re now trying to predict the probability of all 5 outcomes with one constant. Really, the model that corresponds to an intercept only model for our five-way multinomial model is the following:
Model 2: Call~ -1 + traitIn Model 2, there will be four predictors. The fixed effect output of the model gives you the predicted log-odds (=mean log-odds expected by MCMC fitted posterior distribution of those parameters) for four of the five outcomes, relative to the fifth outcome. The predicted log-odds of the fifth outcome are implicit since they are redundant: they can be derived from knowing the log-odds of the other four outcomes since the probability of all outcomes has to sum to 1 (that’s an assumption made by the model, sometimes called exhaustivity). The output of Model 2 will look something like this (the numbers are made up/copied from the output of your larger model):
traitCall.Herbaceous 2.017779 1.319766 2.631103 3.728 <0.03 *
traitCall.Other -0.059957 -0.277582 0.167994 40.000 0.55
traitCall.Shrub 1.985699 1.219209 2.716203 2.025 <0.03 *
traitCall.Tree 0.863295 0.381788 1.431208 4.532 <0.03 *
So the predicted log-odds of a Herbaceous call over a Bare ground call are 2.017779 or about 88.3%
=plogis(2.017779). The predicted log-odds of a Tree call over a Bare ground call are .863295 or about 70.3%. etc. The course notes by Jarrod Hadfield, chapter 5, contain code to translate these predicted log-odds, which are expressed against the baseline, into probabilities for all possible outcomes.Now, let’s turn to the model you first ran, without an `interaction’.
Model 3: Call~ -1 + trait + ResThis model will have only three additional parameters for the four levels of
res. Something like:traitCall.Herbaceous 2.017779 1.319766 2.631103 3.728 <0.03 *
traitCall.Other -0.059957 -0.277582 0.167994 40.000 0.55
traitCall.Shrub 1.985699 1.219209 2.716203 2.025 <0.03 *
traitCall.Tree 0.863295 0.381788 1.431208 4.532 <0.03 *
Res1m 0.251940 0.141353 0.350335 5.852 <0.03 *
Resnaip -0.124915 -0.286551 0.043194 5.987 0.10 .
Res10cm 0.007258 -0.138939 0.135456 3.257 1.00
The interpretation of the
Respredictors is, however, not what you might first think. Those parameters describe the effect thatReshas on the log-odds of any of the four non-baseline outcomes over the baseline outcome. I.e., we’re predicting the effect of resolution on Herbeceous, Other, Shrub, and Tree compared to Bare ground calls.The model with the `interaction’ adds only three parameters because the fourth the `main’ effects of resolution already capture one of the four contrasts that we need to describe the overall effect of resolution. Actually, this becomes easier to see, if instead of:
Model 4a: Call~ -1 + trait * Reswe write:
Model 4b: Call~ -1 - Res + trait * ResThe output should look structurally something like this (again, ignore the numbers):
post.mean l-95% CI u-95% CI eff.samp pMCMC

traitCall.Herbaceous 2.017779 1.319766 2.631103 3.728 <0.03 *

traitCall.Other -0.059957 -0.277582 0.167994 40.000 0.55

traitCall.Shrub 1.985699 1.219209 2.716203 2.025 <0.03 *

traitCall.Tree 0.863295 0.381788 1.431208 4.532 <0.03 *

traitCall.Herbaceous:Res1m 0.251940 0.141353 0.350335 5.852 <0.03 *

traitCall.Other:Res1m -0.160500 -0.257337 -0.062635 4.673 <0.03 *

traitCall.Shrub:Res1m -0.382345 -0.469192 -0.284058 11.096 <0.03 *

traitCall.Tree:Res1m -0.048957 -0.165548 0.064457 10.073 0.35

traitCall.Herbaceous:Resnaip -0.124915 -0.286551 0.043194 5.987 0.10 .

traitCall.Other:Resnaip 0.068419 -0.112842 0.193998 5.869 0.40

traitCall.Shrub:Resnaip 0.290083 0.213862 0.402369 11.026 <0.03 *

traitCall.Tree:Resnaip 0.492460 0.355131 0.631961 7.151 <0.03 *

traitCall.Herbaceous:Res10cm 0.007258 -0.138939 0.135456 3.257 1.00

traitCall.Other:Res10cm -0.066982 -0.166105 -0.001008 12.644 0.05 *

traitCall.Shrub:Res10cm 0.209294 0.114260 0.332900 9.099 <0.03 *

traitCall.Tree:Res10cm -0.018507 -0.134081 0.101332 5.141 0.75
So, now the predicted log-odds of, for example, a Shrub call over a Bare ground call are predicted to decrease if the resolution is 1m rather than 50cm (the coefficient is -0.382345). For a resolution of 50cm, the predicted log-odds of a Shrub call over a Bare ground call are 1.985699. For a resolution of 1m, the predicted log-odds of a Shrub call over a Bare ground call are 1.985699 + -0.382345 = 1.603354. So the predicted probability of a Shrub call over a Bare ground call goes from about 87.9% for a resolution of 50cm down to 83.2% for a resolution of 1m. Since we often don’t care about the specific probabilities, it might be sufficient to say that going from a resolution of 50cm to a resolution of 1m decreases the probability of Shrub relative to a Bare ground call.
Btw, the bottom of the following page contains a nice and simple way to visualize your results (once you have extracted the fitted probabilities from the model).
As for your question about random slopes, unfortunately, I haven’t tried that myself. I couldn’t find direct pointers to this question either (and I have to switch to preparing for a conference). It seems though that what you had in mind is the right thing. Here’s an example for a linear mixed effect model in MCMCglmm with random slopes, which to me suggests that the syntax you suggested should work. Also, have you tried to see what MCMCglmm defaults to when you do not specify the
randomargument for your model?LikeLike
April 7, 2014 at 4:42 pm
You provided a link to http://www.ats.ucla.edu/stat/r/dae/mlogit.htm as a simple way to visualize your results. However, the predict function currently does not work with MCMCglmm… any suggestions on how to visualize data. Can you alter the suggested code so that you are not predicting new data?
LikeLike
April 7, 2014 at 6:12 pm
Hi Kyle, we’re working on a related project that might result in the type of code you’re looking for but I don’t think we’re quite there yet. You could contact Klinton Bicknell, now at Northwestern, to ask him about this (he’s taking the lead in that project). Sorry, to not be more helpful.
Florian
LikeLike
April 8, 2014 at 2:12 pm
Thanks. I did find a wrapper for the MCMCglmm package called mcmcglmm that enables prediction of new data using the PredictNew command, but I haven’t really tried using it yet.
LikeLike
August 30, 2013 at 3:07 pm
Ok, so I noticed that your recommendation of using the formula Call~ -1 -Res + trait*Res didn’t work, instead, it has to be Call~ -1 + trait*Res – Res in order for the 4th interaction to show up. So I got the following output when doing this:
post.mean l-95% CI u-95% CI eff.samp pMCMC
traitCall.Herb 1.95153 1.11930 2.63090 2.241 <0.03 *
traitCall.Other -0.18640 -0.42445 -0.02673 62.460 0.05 *
traitCall.Shrub 2.04203 1.14134 2.69823 2.473 <0.03 *
traitCall.Tree 0.81595 0.33647 1.24168 24.597 <0.03 *
traitCall.Herb:Res1m 0.30195 0.17190 0.43011 2.139 <0.03 *
traitCall.Other:Res1m 0.20085 0.09327 0.29599 21.610 <0.03 *
traitCall.Shrub:Res1m -0.27070 -0.43171 -0.14375 4.281 <0.03 *
traitCall.Tree:Res1m 0.37537 0.26161 0.48194 23.174 <0.03 *
traitCall.Herb:Resnaip -0.06315 -0.15464 0.05195 9.795 0.25
traitCall.Other:Resnaip 0.08218 0.01528 0.20684 13.112 0.05 .
traitCall.Shrub:Resnaip 0.04392 -0.04036 0.14581 12.443 0.45
traitCall.Tree:Resnaip 0.51446 0.39610 0.62859 7.038 <0.03 *
traitCall.Herb:Res50cm 0.13053 0.03043 0.19995 18.936 <0.03 *
traitCall.Other:Res50cm 0.15048 0.07094 0.21995 18.512 <0.03 *
traitCall.Shrub:Res50cm -0.04734 -0.20706 0.07930 9.224 0.50
traitCall.Tree:Res50cm 0.21715 0.11581 0.31486 10.364 <0.03 *
Suppose now that rather than wanting to know the probability that a technician will classify a point as a tree relative to bare ground at the 50cm scale vs the 10cm scale, I just want to know the absolute probability that a technician will classify a pixel as a tree at the 50cm scale vs 10cm scale (basically, I don't care about the relative probabilities between classes, but instead just between resolutions), or say, probability of classifying as a shrub at 50cm vs 10cm. This is pretty tricky to interpret, isn't it.
I can't seem to wrap my heard around it…
LikeLike
August 30, 2013 at 3:43 pm
Hey JP,
great — looks like we’re making progress =)! And thanks for posting the correction (I was surprised that the order matters, but I hadn’t test run the code and it’s perfectly plausible that it matters for the way MCMCglmm parses the formula object). For the interpretation that you’re looking for, I recommend you read the course notes I referred to (http://cran.r-project.org/web/packages/MCMCglmm/vignettes/CourseNotes.pdf, Chapter 5). It actually provides a few lines of code to translate the output of your model into probabilities for each cell of your design and for each level of the response variable. If you get stuck let me know?
Florian
LikeLike
April 7, 2014 at 9:08 pm
I ended up contacting Jarrod Hadfield to resolve this question of testing one group against the next. I framed it using his example from Pg. 101 of the course notes:
ME:
“I was wondering if you could provide some insight on how to find p-values for the example on p101 of your course notes. I am specifically interested in how I might go about testing whether there is a significant difference between the probability of observing polled males vs polled females. I understand how to use the HPDinterval function to obtain credible intervals, but is there a similar function that can obtain p-values for those credible intervals?”
J. Hadfield:
“The p-values in summary.MCMCglmm are obtained using:
2 * pmax(0.5/length(x), pmin(sum(x > 0)/length(x), 1 – sum(x > 0)/length(x)))
where in your case x would be the difference in probabilities. Its not ideal, but probably gives a fairly reliable answer.”
So it’s been a while, and I don’t quite remember what’s going on here, but essentially, ‘x’ is a vector containing the differences in probabilities for each iteration. Beyond that, it’s not clear to me what is going on. It seemed to work out though and gave me the test I was looking for.
LikeLike
April 8, 2014 at 2:02 pm
Thanks for posting this. Much appreciated. I’m swamped right now and won’t get to play around with this for a while, but I’m sure others will be happy to see this solution posted.
LikeLike
August 29, 2013 at 12:41 pm
Also, there is more documentation and information in the MCMCglmm authors course:
Click to access CourseNotes.pdf
LikeLike
January 25, 2014 at 4:40 am
I can’t figure out how to specify heteroskedasticity on level 1 in MCMCglmm. Basically, I’ve got individuals within countries, and my research question is how does variance for individuals (after control for the country-level) changes with my predictor, which is time. I have estimated that model in MLwiN, and I can reproduce it almost completely in MCMCglmm, except for specifying the predictor for variance on the inividual level. Can it be done? Thank you so much in advance.
LikeLike
January 29, 2014 at 10:58 am
Hi Maxim,
sorry, I’m swamped at the moment and don’t know from the top of my head the answer to your question. I would recommend that you write to the developer of the package (Jarrod Hadfield) or to the r-sig-mixed-models email list (he’s one of the people replying). If you have the time, it’d be great if you could post a summary of the reply here? In the meantime, I approved this post, so that readers of this blog can jump in and throw in their answer.
Sorry, to not be of more help!
LikeLike
April 24, 2014 at 6:19 am
Hi Tiflo,
There is something I am a little confused about regarding the code for the prior structure on the residuals.
R = list(fix=1, V=0.5 * (I + J), n = 4)
You mention that this fixes the off-diagonal terms to 0.5 as suggested by the table in the MCMCglmm tutorial. This table suggests that for “categorical” models, as we have here, V = (1/k) * (I+J), where I is the identity matrix (diagonals = 1 and off-diagonals = 0), and J is a unit matrix (all values = 1), both of dimension k-1.
If this is correct, I am a little unsure where the 0.5 value is coming from, given that (1/k) * (I + J) and 0.5 * (I + J) produce different matrices. Maybe I have missed something fundamentally obvious here – but I am very confused, could you perhaps explain why the 0.5 value is used here?
Thank you very much for a very clearly written tutorial and explanation from someone who is having lots of trouble how to run and understand such models…!
Jo
LikeLike
April 24, 2014 at 12:00 pm
Dear Jo,
this tutorial was written by Austin Frank, who has left the field and is unfortunately not maintaining this thread anymore. I suspect that the .5 is a type, probably from originally running the model against a binary outcome variable (in which case 1/k = 1/2 = .5). Since
SemanticClasshas 5 levels, it seems the .5 should be substituted by a .2. I’m writing this in a hurry and don’t currently have time to look back at the manual, but this would be my best bet. Anyone else should feel free to chime in.Florian
LikeLike
April 24, 2014 at 12:30 pm
Hi Florian,
Thank you very much for your response.
This is what I suspected – I just wanted to check that I wasn’t missing anything fundamentally obvious.
I am trying to understand how to answer the question: “Is there a difference in the observed frequencies of a three-state character between group A and group B, whilst also accounting for other random effects?”
This blog post in itself has got me a lot further than anywhere else – I just need to figure out how to answer the first half of the question (i.e. interpreting the results of such a model) before even attempting to add in more random effects!
Thanks again,
Jo
LikeLike
May 8, 2014 at 8:01 am
Hi Jo, do you mean that you have a three-way categorical outcome and want predict counts based on a binary categorical predictor? What are your remaining questions?
LikeLike
May 20, 2014 at 9:42 am
Hi,
Firstly, thank you very much for this help which is very useful and extremely well explain!!!
I just have a question about the R-structure. In fact you said that like in the tutorial you are fixing the variance to be 1 for all of the diagonal terms (variances) and .5 for all of the off-diagonal terms (covariances). In other words, you are using the matrix : 0.5 * (I+J).
In the tutorial, Jarrod advices to use (1/J)*(I+J). So, I have 2 for all the diagonal terms and 1 for all the off-diagonal terms.
Matrix are proportionnal, but I’m not sure about the impact on my model … Is there a difference if I use one rather than the other?!
Thank you very much!
Mathilde
LikeLike
July 27, 2014 at 2:37 pm
Thanks so much to everyone who has contributed to this thread – it has been very helpful! I hope my question below regarding the predict function will also be of use to others.
I have a MCMCglmm multinomial model that is running nicely, but I need to assess model-predicted values for each data point so I can cross-validate, yet I do not know how to interpret the output of the predict function. There are three possible values of the response variable (let’s call them A, B, and C). I have 634 data points total, but 1268 rows in the output of the predict function, which makes me think there is both a probability B is more likely than A and a probability that C is more likely than A for each point, but because they are all in one column and don’t have an index, I don’t know what point each row corresponds to.
My predict function looks like this:
m.pred<-predict(model,type="response",interval="prediction")
And the output from "predict" looks like this (again, n = 634):
fit lwr upr
1 0.07529940 0.0009159809 0.2450521
2 0.26639933 0.0006481384 0.8171763
3 0.08842384 0.0011288143 0.2682600
4 0.28736411 0.0001511912 0.8286539
5 0.11389115 0.0013791012 0.3841322
6 0.21789723 0.0058586078 0.5767750
…
1268 0.24447799 5.553336e-03 0.6738022
I apologize if this is clearly discussed in the Course Notes or other documents, but I just cannot seem to find it. I would be very grateful to anyone who can provide insight on how to interpret the predict function output.
Many thanks,
Justine
LikeLike
July 27, 2014 at 3:01 pm
Hi Justine,
I’m in a bus atm, so I have only limited access. I had a quick look around and there’s indeed no clear instruction in the tutorial, etc. I recommend that you hugely simplify your data and then map the output of the predict function back to the expectations you’d get from a cross-tabulation. But perhaps someone has looked at this recently and will respond quickly. Oh, and make sure to marginalize over whatever random effects are appropriate for your question (see notes in the predict.MCMCglmm help file and on the web).
Florian
LikeLike
July 27, 2014 at 4:58 pm
Hi Florian,
Thank you so much for your quick response. I’m afraid I don’t quite understand what you mean by simplify my data. Unfortunately, I am stuck with three response values (or else I would just do a mixed-effects logistic regression) and want to include a random effect. I believe the predict function should be easily interpretable (as the number of returned values is logical), but I just don’t know to which data point and model (A vs B or A vs C) they belong.
I did mean to marginalize over the random effects. The predict function should then be:
m.pred<-predict(mt,type="response",interval="prediction",marginal=model$Random$formula)
My model is:
k<-3
I<-diag(k-1)
J<-matrix(rep(1,(k-1)^2),c(k-1,k-1))
IJ<-(1/k)*diag(2)+J
prior <- list( R = list(V=IJ,fix=1), G = list(G1 = list(V = diag(2),n = 0.002)))
model <- MCMCglmm(pcl2 ~ -1+trait + trait:ngtr1 + trait:bin1 + trait:night1,
random = ~ us(1+night1):lID,
rcov=~us(trait):units,
prior = prior,
burnin = 30000,
nitt = 200000,
family = "categorical",
data = killsdf,
verbose=FALSE,
DIC=TRUE,
pr=TRUE,
thin=200)
It's a bit complex because I want to allow for different coefficient values for the A vs B and the A vs C models. I also have both a random slope and random intercept.
I'm not completely sure I understand what you mean by "map the output of the predict function back to the expectations you’d get from a cross-tabulation". I did try to calculate the model value for the first few data points by writing out the model with correct coefficients, but did not receive the same numbers as the predict function (with type="terms").
Thanks again for your assistance.
Best,
Justine
LikeLike
July 27, 2014 at 11:32 pm
Hi Justine,
I meant that it might help to make a very small ‘fake’ data set with three outcomes, for which it’s simple enough to see what the fitted probabilities should look like. Then you can infer from that how the output of predict.MCMCglmm() is structured. Does that make sense? Alternatively, you could also just send an email to the R help list for MCMCglmm (e.g., the mixed models help list) and you’ll probably get an answer rather fast.
I wasn’t suggesting to simplify your model in anyway. I’d look at it myself, but I’m traveling atm.
Florian
LikeLike
July 29, 2014 at 6:38 pm
Hi Florian,
Thanks so much for your advice! In case anyone is curious about the same issues, I received a very helpful response from Jarrod Hadfield:
http://comments.gmane.org/gmane.comp.lang.r.lme4.devel/12175
Justine
LikeLike
October 1, 2014 at 6:25 pm
I’m wondering whether you can help me sort out whether I can use a multinomial MCMCglmm model with my data, or whether I need to use a multi-response MCMCglmm instead. The data are structured like this, where dyad, focal, other are all random effects, predict1-2 are predictor variables, and response 1-5 are outcome variables that capture # of observed behaviors of different subtypes (so, if you add them all up, they’ll give a total # of the behavior per dyad, which I’ve called totalresp here):
dyad focal other predict1 predict2 resp1 resp2 resp3 resp4 resp5 totalresp
1 10101 14302 0.5 3 1 0 0 4 0 5
2 10405 11301 0.0 5 0 0 0 1 0 1
…
What I want to do is compare the effects of predict1 and predict2 (and various combinations of up to 4 predictor variables) on all 5 response variables. It’s been suggested to me that I use a multinomial model with a vector of outcomes for each dyad (ie, resp1-resp5), but based on the existing MCMCglmm course notes, I can’t see how to do this. The multinomial MCMCglmm examples I’ve seen all operate with a single outcome value, rather than multiple values per line of data.
The other alternative is a multi-response MCMCglmm, and I’ve been able to implement that – however, I’m only able to get different intercepts for each response variable, when what I want is also to allow the effects/slopes to vary. It’s possible I’m misunderstanding the advice, also possible I’m just not enough of an expert programmer to know how to implement it. Your advice (and additional examples that correspond to this problem) would be much appreciated!
LikeLike
October 2, 2014 at 4:59 pm
Hi Michelle,
multi-response is just a term to refer to multivariate models, which are a superset of the multinomial model. A multinomial model is certainly a solution to your problem. Just imagine you reformatted your data to have k rows for each current row, where k is the value of totalresp. In each row only one outcome would have value 1, all other outcomes would have value 0 (e.g., for the first row, there’d be one row with value 1 for resp1 and four rows with value 1 for resp4, all other respX values being 0). You probably don’t even have to reformat your data. It’s best you directly ask Jarrod Hadfield for the relevant code or post to one of the R help lists. If you don’t mind, feel free to post his answers here, so that others can benefit from it?
Thanks and sorry to not be of more help (swamped).
LikeLike
November 19, 2014 at 1:50 pm
I’m still not to the point of interpreting or plotting the output, but I’ve been able to configure a multinomial mcmcglmm model in R, without reformatting my data.
The code looks like this:
m <- MCMCglmm(cbind(Response1 , Response2, Response3, Response4, Response5) ~ -1 + trait +trait*r -r,
random = ~ us(trait): RandomVariable1,
rcov = ~ us(trait):units,
prior = list(
R = list(fix=1, V=0.5 * (I + J), n = 4),
G = list(
G1 = list(V = diag(4), n = 4))),
burnin = 5000,
nitt = 20000,
family = "multinomial5",
data = datanoz)
Unlike in a model with only one outcome variable, I'm not able to easily incorporate zero inflation (since a zipoisson model is a type of multinomial model, in my understanding, perhaps there is a way to do this?) My plan for now is to run the models with and without zeros in the data on the principle that more info is better and that zeros may or may not be special in this case. The output looks like this:
post.mean l-95% CI u-95% CI eff.samp pMCMC
traitResponse2 -4.4581642 -5.5474420 -3.2571624 25.01037 0.0002222222
traitResponse3 -3.1700001 -3.9197915 -2.5490904 66.55956 0.0002222222
traitResponse4 -1.3494157 -1.7398534 -0.9305783 233.94902 0.0002222222
traitResponse5 -2.8730546 -3.5283299 -2.2638502 67.94224 0.0002222222
traitResponse2:r 2.7079232 0.6725094 4.7915331 94.89078 0.0146666667
traitResponse3:r 0.1789176 -1.4338497 1.7346192 170.29191 0.8142222222
traitResponse4:r -0.5936004 -1.7407774 0.5565017 316.97832 0.3217777778
traitResponse5:r 0.6709606 -0.8109756 2.1263960 90.63556 0.3826666667
Using -1 and -r in the fixed effects suppresses the intercept and the main effect for r, so that I instead get coefficients for Response variables 2 through 5. Based on the text and comments on this post, though, I'm not sure how to interpret them. My response variables are not mutually exclusive, so I can't interpret the coefficient for Response3 as the log-odds of Response3 in comparison to the baseline of Response1, right?
The outputs *look* like log odds, but that doesn't make a lot of sense to me, because the Response variables are all counts (from zero to infinity). I suppose it's possible to use this kind of data to estimate log odds, but it's not intuitive to me. Time to check the course notes again – if anyone can suggest additional resources, please do.
LikeLike
October 6, 2014 at 10:01 pm
[…] outcome variable with 3 levels (sheep horns of 3 types). Similar treatment can be found here: https://hlplab.wordpress.com/2009/05/07/multinomial-random-effects-models-in-r/ This is not quite right for what I’m doing, but contains helpful background […]
LikeLike
April 26, 2016 at 11:08 am
Hi Florian,
Thank you very much for this tutorial and the answers provided in the comments. They have been extremely helpful when looking at my own data analysis. However, I was wondering if I could also ask for some assistance, as there are some questions that I haven’t been able to find an answer for after reading this and the course notes. It’s been a long time since this blog post has been written, but here it goes…
I would like to analyze some data from an identification task, in which subjects hear a V1h[V2]pV1 stimulus (e.g. ah[i]pa), where [V2] designates the coarticulation within the /hp/ cluster (V1 != V2 when the stimuli have been spliced). My subjects are asked what vowel they perceived between the consonants of the cluster (vowel epenthesis).
In particular, I’m interested in the relative contributions of V1 and V2 on the choice of each response vowel (e.g., do subjects choose /i/ more often than other vowels when V1=/i/? Even more or less so when COART=[i]? Which contribution is more important between V1 and V2?)
First, here is a recap of my variables (first value /u/ = baseline; as that is the “default” epenthetic vowel):
* RV:
– RESP (categorical, 5 levels): {u, o, i, e, a}
* IV:
– V1 (categorical, 5 levels): {u, o, i, e, a} – sum-contrast coded
– V2, named COART for easier reading (categorical, 5 levels): {u, o, i, e, a} – sum-contrast coded
* Random effects: subject id (SUBJ), item id (ITEM).
Which gives me the following model:
k <- length(levels(h.epenth$RESP))
I <- diag(k-1)
J <- matrix(rep(1, (k-1)^2), c(k-1, k-1))
prior3 = list(R = list(fix=1, V=(1/k) * (I + J), n = k),
G = list(G1=list(V = diag(k-1), n = k),
G1=list(V = diag(k-1), n = k)))
mh1 <- MCMCglmm(RESP ~ – 1 + trait + V1:trait + COART:trait,
random = ~us(trait):SUBJ + us(trait):ITEM,
rcov = ~ us(trait):units,
prior = prior3,
burnin = nburnin,
nitt = nnitt,
thin = nthin,
family="categorical",
data=epenth)
I'm currently running the model on pilot data and with 20000 iterations only, so the actual values of the estimated coefficients are not important, but here is the output from summary(mh1), for location effects:
Location effects: RESP ~ -1 + trait + V1:trait + COART:trait
post.mean l-95% CI u-95% CI eff.samp pMCMC
traitRESP.o -3.59168 -6.51885 -0.40005 340.00 0.03529 *
traitRESP.i -6.97617 -10.20436 -3.63351 340.00 < 0.003 **
traitRESP.e -7.58867 -10.16525 -4.44600 17.06 < 0.003 **
traitRESP.a -6.32136 -8.75020 -3.92369 170.22 < 0.003 **
—-
traitRESP.o:V1o 0.96720 -1.91595 4.68645 57.00 0.57059
traitRESP.i:V1o 0.34601 -3.13529 3.65788 275.27 0.81176
traitRESP.e:V1o 0.01064 -2.31169 2.48395 179.78 0.94706
traitRESP.a:V1o -0.08993 -2.52314 2.14315 134.33 0.97059
traitRESP.o:V1i -0.57546 -3.82799 2.97239 18.85 0.81765
traitRESP.i:V1i 5.34557 2.23693 8.74984 398.06 0.01176 *
traitRESP.e:V1i 2.43926 0.20358 5.15729 68.81 0.07059 .
traitRESP.a:V1i 1.65012 -1.21129 3.84189 177.83 0.17647
traitRESP.o:V1e -1.16602 -4.16428 2.01458 86.38 0.46471
traitRESP.i:V1e 4.68686 1.38014 7.48422 202.13 < 0.003 **
traitRESP.e:V1e 5.03065 2.33411 7.25455 17.88 < 0.003 **
traitRESP.a:V1e 0.55748 -2.02347 3.63707 4.68 0.74706
traitRESP.o:V1a -0.49801 -4.05488 2.82815 340.00 0.78824
traitRESP.i:V1a 1.20223 -2.48158 4.27902 252.94 0.53529
traitRESP.e:V1a 1.41483 -1.13591 3.77316 254.96 0.28235
traitRESP.a:V1a 3.04426 0.49008 5.59015 340.00 0.01765 *
—-
traitRESP.o:COARTo -0.30663 -3.86220 2.94796 287.64 0.88824
traitRESP.i:COARTo 0.92669 -2.28283 4.60833 340.00 0.56471
traitRESP.e:COARTo -0.05533 -2.61372 2.40955 140.88 0.96471
traitRESP.a:COARTo 0.13161 -2.46333 2.22642 340.00 0.92353
traitRESP.o:COARTi -1.37804 -5.35041 1.66590 51.21 0.42353
traitRESP.i:COARTi 5.54896 1.53047 8.69056 340.00 0.00588 **
traitRESP.e:COARTi 2.37792 -0.33337 4.73054 340.00 0.08824 .
traitRESP.a:COARTi 0.59577 -1.90546 2.99576 175.13 0.61176
traitRESP.o:COARTe -1.90106 -5.67091 1.52474 33.76 0.33529
traitRESP.i:COARTe 5.57507 2.15612 8.66226 340.00 0.00588 **
traitRESP.e:COARTe 2.44821 -0.28758 4.69727 340.00 0.05882 .
traitRESP.a:COARTe 0.53713 -1.72573 2.66476 340.00 0.64118
traitRESP.o:COARTa -1.16952 -4.53311 2.54438 45.44 0.52353
traitRESP.i:COARTa 0.96946 -3.23285 4.17157 206.69 0.61765
traitRESP.e:COARTa 0.76110 -1.74846 3.68853 340.00 0.54118
traitRESP.a:COARTa 1.98751 -0.73148 4.65783 29.15 0.15294
1) Knowing that I sum-contrast coded the independent variables V1 and COART, is it correct for me to interpret
post.mean l-95% CI u-95% CI eff.samp pMCMC
traitRESP.i:COARTe 5.57507 2.15612 8.66226 340.00 0.00588 **
as: "there is a significant increase in "i" responses relative to "u" responses when the coarticulation in the cluster (i.e. [V2]/COART) is [e], for an 'average' V1" (as opposed to only comparing the change in "i" vs "u" responses when going from uh[u]pu to uh[e]pu, since /u/ is the baseline for V1 and COART)
2) Following up on this, would contrast coding RESP (if there is any sense in doing that, model wise) allow me to change the statement above to: "there is a significant increase in "i" responses relative to any other response vowel when the coarticulation in the cluster (i.e. [V2]/COART) is /e/, for an 'average' V1", or does the trait always take "u" as a baseline?
3) I guess I am a confused about how to interpret the significance codes. Basically, for
post.mean l-95% CI u-95% CI eff.samp pMCMC
traitRESP.o -3.59168 -6.51885 -0.40005 340.00 0.03529 *
traitRESP.i -6.97617 -10.20436 -3.63351 340.00 < 0.003 **
traitRESP.e -7.58867 -10.16525 -4.44600 17.06 < 0.003 **
traitRESP.a -6.32136 -8.75020 -3.92369 170.22 < 0.003 **
I understand this as: subjects responded "u" significantly more often than "o", "i", "e" and "a", in general. Is this correct?
If so, are these significance tests "independent" from the significance testing for V1:trait and for COART:trait that appear below in the summary?
I hope that my explanations are not too unclear…
Thank you in advance for your help!
Best,
Adriana
LikeLike
April 26, 2016 at 7:38 pm
Dear Adriana, I’ve approved your query in the hope that someone else can jump in, as I won’t have time to look at this until the at least 5/25 (grant deadlines, graduation, reviewing, etc.). Sorry!
LikeLike
February 23, 2017 at 6:29 am
Hello Florian,
first of all, thanks for your tutorial, it’s absolutely clear and it was very helpful for my own research. One quick question I would like to ask you:
In the analysis I am doing, I fit a multinomial model with random effects and, after that, I want to analyze whether the inclusion of these effects is of importance, or whether if I could just use a standard multinomial model. In linear models, I know that you have some idea about the importance of the random effects by comparing the variance of the random parameters with the residual variance. If the residual variance is much larger, we can conclude that little is added by including random effects.
Do you know if I can do a similar reasoning in the multinomial case? I ask you because reproducing your code, I appear to get only the exact values we fixed for the V-matrix in the R-structure. Am I missing something?
Thank you in advance!
Best,
Gabriel
LikeLike
February 23, 2017 at 12:09 pm
Hi Gabriel,
I haven’t been using mcmcglmm recently, so I’m not the best to answer the specifics. But unlike linear models, the multinomial models don’t have residuals, so that approach won’t work. Have you read http://glmm.wikidot.com/faq (“How can I test whether a random effect is significant?”)?
Florian
LikeLike
August 8, 2018 at 8:11 pm
Hi Florian,
I panicked reading this tutorial because I don’t understand a lot of it. I’m pretty new at stats.
Before suffering while learning this, I wanted to make sure this is what I need.
Mine is a memory study, in which subjects learned 48 items and were tested at different time intervals on 16 of these items. I scored each item as 0, .5 or 1 (.5 was when they got half of the item correct). I thought it was ordered multinomial data but all the literature of similar studies treats the dependent variable (accuracy) as a continuous variable, and just use ANOVAs.
After reading one of your papers I think that’s plain wrong, but many experts on the subject can’t be wrong… can they?
I would like to know if you think I can use your tutorial for my analysis, or if I should save myself the hassle and just treat the DV as a continuous from 0 to 16 and use a linear mixed model instead. I can’t use ANOVAs after reading your paper.
Thank you.
LikeLike
August 9, 2018 at 1:08 am
Hi
This sounds like a case where you code your data at a more fine grained level, and then treat it as binomial data (and use mixed logistic regression). Eg if each ‘item’ had two parts, each of which one can get right or wrong, you could treat these two parts as items and have random effects for them (possibly *also* having random effects by what you currently call an item). Accuracy would then be 0 or 1, and analyzed as eg
Accuracy ~ 1+ Cond + (1 + Cond | Subject) + (1 + Cond | Item)
Does that help? You wouldn’t even need multinomial models in that case (just mixed logistic regression). I won’t be available for the next few days but hopefully others can help, too. I’ll check in again next week.
Florian
LikeLike
August 9, 2018 at 3:00 am
Thank you for the speedy response. That was a creative solution! I will try to do it and see what happens. The items are phrases like “played the guitar”, and I gave .5 if they remember the verb OR the noun, and 1 point for the whole phrase. I don’t know if I will be able to interpret the coefficients if I code it that way. More precisely, I don’t know how I will distinguish between the probability of getting the whole phrase correct vs only part of it if both parts are coded as 1.
Anyway, I will try that today and maybe by the time you’re back I’ll know better. I’m deeply grateful for your response and help.
LikeLike