correlation plots
Correlation plot matrices using the ellipse library
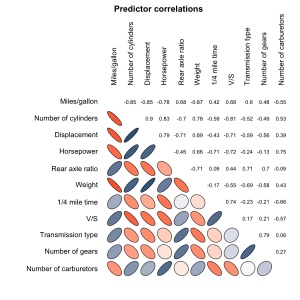
My new favorite library is the ellipse library. It includes functions for creating ellipses from various objects. It has a function, plotcorr() to create a correlation matrix where each correlation is represented with an ellipse approximating the shape of a bivariate normal distribution with the same correlation. While the function itself works well, I wanted a bit more redundancy in my plots and modified the code. I kept (most of) the main features provided by the function and I’ve included a few: the ability to plot ellipses and correlation values on the same plot, the ability to manipulate what is placed along the diagonal and the rounding behavior of the numbers plotted. Here is an example with some color manipulations. The colors represent the strength and direction of the correlation, -1 to 0 to 1, with University of Rochester approved red to white to blue.
First the function code:
